|
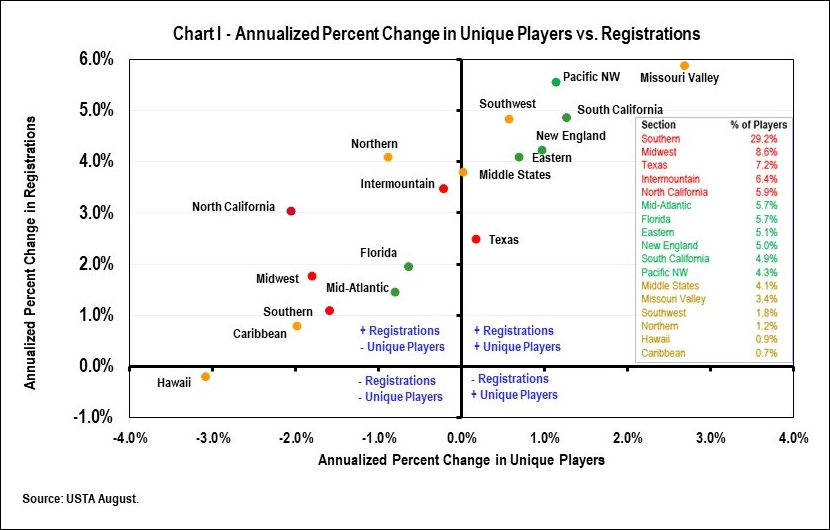
Small Category
The three largest USTA sections in the small category posted
increases in their number of unique players, while there were
declines in the three smaller USTA sections (Table III). Data
for the Caribbean section were adversely affected by hurricane
damage to facilities between 2010 and 2019.
The small category accounted
for slightly more than 12% of unique players in 2019 and the
number of unique players increased at an annualized rate of 0.3%.
On average, the small category
increased the number of registrations by 3.9%. It accounted for
approximately 17% of total new registrations between 2010 and
2019. About 11% of the registrations in 2019 were in the small
category.
In 2019 the ratio of registrations
per unique player was 2.5, an increase from 1.8 in 2010.
Summary The small category made a positive contribution
to the change in registrations and unique players between 2010
and 2019.
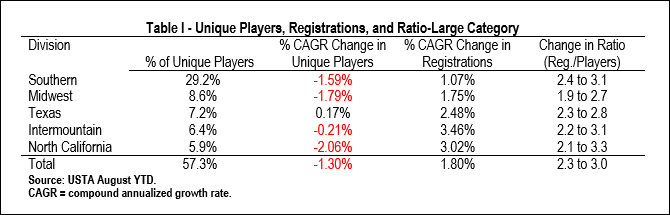
Registrations vs. Unique Players
- 17 Sections
The second phase of analysis illustrates the relationship between
unique players and registrations for the 17 sections (Chart I).
The one USTA section in the bottom quadrant on the left-hand
side had declines in both registrations and the number of unique
players. It represents 0.9% of total unique players.
The eight sections plotted in
the upper left-hand quadrant had declines in the number of unique
players but increases in the number of registrations. They accounted
for 63.4% of total unique players.
Finally, the eight sections in
the upper right-hand quadrant had increases in the number of
unique players and registrations. They accounted for 35.7% of
total players. Seven of these eight sections are from the small
and middle-sized categories.

Key Findings
The data in the above tables and chart is consistent with discussions
in online coaching groups that indicate there are disparities
in the growth of the sport throughout the country.
The chart shows that about two-thirds
of the unique players are in USTA sections that experienced declines
in the number of unique league players between 2010 and 2019.
It is tempting to assume these sections are the source of the
decline in total participation for the U.S., but there is not
enough data in this analysis to make such a statement.
The data also shows that larger
sections tend to have higher ratios of registrations per unique
players. It is easy to hypothesize that these sections place
greater emphasis on registrations, core players, and revenue
generation rather than bringing more players to the USTA League.
Again, this might be the case, but there is insufficient data
to reach that conclusion.
A final conjecture is that activity
in the USTA League is more dynamic in the divisions in the top
right corner of Chart I (Missouri Valley, Pacific NW, Southern
California, and Southwest) because they have strong growth in
both the number of registrations and unique players. Further
analysis is needed to determine whether there is merit to this
tendency.
Moving Forward
The USTA League is an important part of the tennis culture at
facilities in all USTA sections; however, league players comprise
a small percent of the tennis population. A case can be made
that the USTA league is more important to the USTA than it is
to the industry because it generates memberships, player contact
lists, a revenue stream, and brand awareness.
For that reason, tennis professionals
and coaches must remain focused on meeting the needs and preferences
of the players in their spheres of influence. The downturn in
tennis activity hasn't changed the fact that tennis continues
to be a great game to play, instruct, and watch. In time, the
current downturn in tennis activity will pass, just as tennis
professionals and the industry showed great perseverance to survive
the boom and the bust of the Bobby Riggs vs. Billie Jean King
era. |